+ Unit 1 Notes Videos
The Periodic Table
The NEW Periodic Table Song
|
|
|
Introduction to Chemistry
|
|
|
Slope of Mass/Volume as Density (Density Graphs)
When mass is on the y-axis, and volume is on the x-axis, then the slope of the line (rise/run, or Δy/Δx) is the density of the substance because D=M/V
When mass is on the y-axis, and volume is on the x-axis, then the slope of the line (rise/run, or Δy/Δx) is the density of the substance because D=M/V
Mathematics and Data
|
|
Mr. Lee says:
Don't understand dimensional analysis (also called unit conversions)? Tyler DeWitt has many helpful videos on his channel. I won't link them all on CHEMSTEM but be sure to check out his great stuff in order to master this important skill. |
Overview: Accuracy, Precision, Measurement, and Significant Figures (Michael Farabaugh)
|
Accuracy and Precision, Part 2 (Tyler DeWitt)
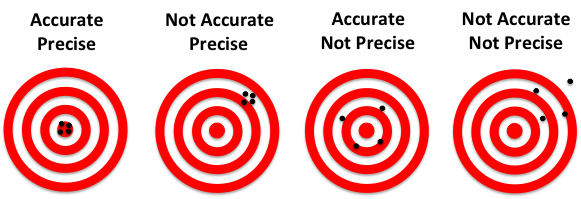
When given data (such as trials), take the AVERAGE to help determine accuracy, and the RANGE to help determine precision. Data is more accurate if the average is closer to the actual (accepted) value. Data is more precise if the range of measurements is smaller. (A good synonym for precision is "consistent".) |
|
Significant Figures Tutorial
There are multiple videos in the playlist. Watch as many as you need or want.
There are multiple videos in the playlist. Watch as many as you need or want.
New for Fall 2018:
- Accuracy and precision examples with trial data
- General percent error examples
- Significant figures examples
Lab Techniques & Procedures for Solutions and Mixtures
Overview of Some Separation Techniques
Filtration
This technique separates solid from liquid. The paper "catches" the solid, and the liquid solvent goes through the paper and is collected. This is like a coffee filter, where the solid grinds are caught, and the liquid moves through.
This technique separates solid from liquid. The paper "catches" the solid, and the liquid solvent goes through the paper and is collected. This is like a coffee filter, where the solid grinds are caught, and the liquid moves through.
Evaporation & Distillation
An example of evaporation is trying to separate dissolved salt (the solute) from the water in which the salt is dissolved (the solvent). If you have a saltwater solution, you can separate the salt and the water by boiling the water. The steam is collected, condensed, and is pure water. (The solute was left behind, though). Distillation occurs when trying to separate a liquid-liquid solution.
An example of evaporation is trying to separate dissolved salt (the solute) from the water in which the salt is dissolved (the solvent). If you have a saltwater solution, you can separate the salt and the water by boiling the water. The steam is collected, condensed, and is pure water. (The solute was left behind, though). Distillation occurs when trying to separate a liquid-liquid solution.
